Updated 16 October 2026 | Estimated reading time: 8–9 minutes
India’s combined merchandise and services exports were estimated at US$476.20 billion during April–September 2026–27, an increase of 13.84% over the same six months of 2025–26. The Ministry of Commerce and Industry released the estimate through the Press Information Bureau on 15 October. It is a useful current-affairs update for banking, economy, commerce and general-awareness preparation because it includes both the headline growth rate and enough underlying data to test whether a candidate understands what the number does—and does not—mean.
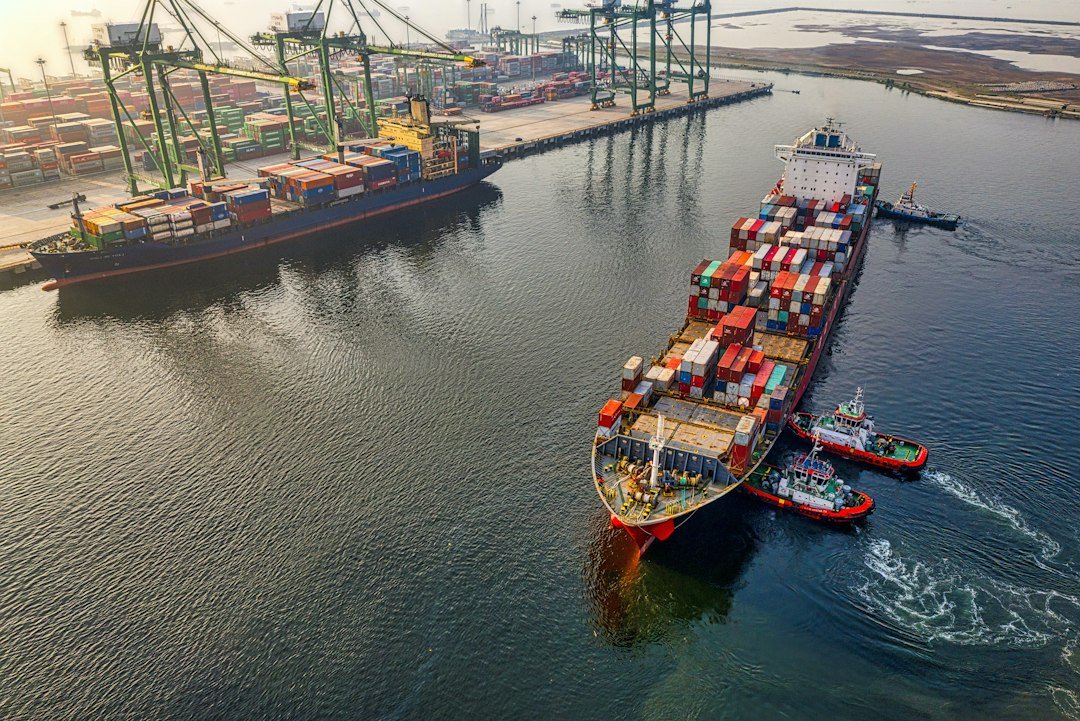
Illustrative photograph: william william / Unsplash. The image represents international cargo shipping and is not intended to depict a particular Indian port or shipment.
What happened?
The total value of exports (merchandise plus services) for April–September 2026–27 was estimated at US$476.20 billion, compared with US$418.31 billion in April–September 2025–26. The increase in absolute value was US$57.89 billion. Total imports over the same period were estimated at US$551.13 billion, compared with US$476.42 billion a year earlier.
The headline is positive export growth, but the accompanying import data are essential. Imports grew by an estimated 15.68%, faster than the 13.84% growth in total exports, leaving an estimated combined trade deficit of US$74.93 billion. In the corresponding period a year earlier, the deficit was US$58.10 billion. Export performance therefore needs to be read alongside import demand, prices, industrial inputs and the balance between merchandise and services.
Official data at a glance
| Measure | April–September 2026–27 | April–September 2025–26 | Change / interpretation |
|---|---|---|---|
| Total exports: goods + services | US$476.20 bn | US$418.31 bn | Estimated growth: 13.84% |
| Merchandise exports | US$259.89 bn | US$219.30 bn | Growth: 18.51% |
| Services exports | US$216.31 bn | US$199.02 bn | Estimated growth: 8.69% |
| Total imports: goods + services | US$551.13 bn | US$476.42 bn | Estimated growth: 15.68% |
| Combined trade balance | –US$74.93 bn | –US$58.10 bn | Deficit widened by US$16.83 bn |
| Merchandise trade deficit | US$177.64 bn | US$156.88 bn | Goods imports substantially exceeded goods exports |
| Services trade surplus | US$102.71 bn | US$98.77 bn | Services surplus increased |
The figures are estimates in US dollars, not rupee amounts. “Billion” means one thousand million; US$476.20 billion is not the same as US$476.20 million. The official release gives values to two decimal places, so it is better to preserve that precision when quoting the source rather than rounding every number inconsistently.
Goods and services: why the split matters
Merchandise exports are exports of physical goods, such as electronics, engineering products, petroleum products, chemicals, textiles or agricultural products. The Ministry put merchandise exports at US$259.89 billion for April–September, up from US$219.30 billion a year earlier. The year-on-year growth rate was 18.51%.
Services exports include cross-border services such as software and IT-enabled services, professional services, transport and other service categories counted under the applicable external-sector statistics. Services exports were estimated at US$216.31 billion, compared with US$199.02 billion in the previous corresponding period. The Ministry reported growth of 8.69%.
The two components respond to different forces. Merchandise performance is affected by global goods demand, prices, supply chains, transport costs and domestic production capacity. Services trade can depend on demand for digitally delivered or professional work, travel and transport services, and how transactions are recorded. Comparing their growth rates offers more information than looking at the total alone.
Which merchandise categories grew in September?
The Ministry’s September 2026 release identified several product groups with positive year-on-year growth:
- Electronic goods: US$5.31 billion in September 2026, compared with US$3.11 billion in September 2025; increase of 70.44%.
- Petroleum products: US$6.22 billion, compared with US$4.71 billion; increase of 31.90%.
- Organic and inorganic chemicals: US$2.94 billion, compared with US$2.37 billion; increase of 24.21%.
- Engineering goods: US$12.17 billion, compared with US$10.06 billion; increase of 20.91%.
- Cotton yarn, fabrics, made-ups and handloom products: US$1.12 billion, compared with US$0.93 billion; increase of 20.76%.
Electronic goods recorded the highest percentage increase among these examples, but that does not make them the largest export category by value in the list. Engineering goods had a higher September value at US$12.17 billion. Percentage growth answers how quickly a value changed relative to the previous period; absolute value answers how large it was. Competitive-exam questions often test this distinction.
Other categories listed by the ministry also recorded positive growth, including other cereals, handicrafts, meat/dairy/poultry products, plastics and linoleum, carpets, gems and jewellery, processed cereal preparations, minerals, readymade garments, coffee, marine products, oil seeds, leather goods, pharmaceuticals, rice and spices. These are official reported growth rates for September, not guarantees of continued growth in subsequent months.
September trade: the monthly picture
Total exports of merchandise and services for September 2026 were estimated at US$80.75 billion, up 10.99% from US$72.76 billion in September 2025. Total imports were estimated at US$94.05 billion, up 8.19% from US$86.93 billion. The combined trade deficit was US$13.30 billion, narrower than US$14.17 billion in September 2025.
Merchandise exports were US$44.40 billion in September 2026, compared with US$36.08 billion a year earlier. Merchandise imports were US$74.61 billion, compared with US$69.08 billion. The service figures were estimated at US$36.35 billion in exports and US$19.44 billion in imports.
There is no contradiction between a wider deficit for the first six months and a narrower deficit for the month of September. The half-year number accumulates all six months; the September number covers one month only. Different monthly paths can produce different outcomes over different reference periods.
Read the data caveats before quoting the figures
The official release explicitly notes that September 2026 services data are estimates because the latest services-sector data released by the Reserve Bank of India at the time were for August 2026. It also says data for April–September 2025–26 and April–June 2026–27 were revised on a pro-rata basis using quarterly balance-of-payments data.
That caveat is important for both exams and professional reporting. Some trade totals are built from merchandise data and estimates for services. Subsequent updates can revise figures as more complete information becomes available. A precise report should state the issuing authority, the release date, the reference period and whether the number is estimated or final.
Why it matters for the economy
Exports are a source of foreign-exchange earnings and connect domestic businesses to overseas demand. Goods export growth can support manufacturers and associated logistics, warehousing, port and transport activity. Service exports matter because they can generate foreign-exchange receipts without moving a physical product through a port. A broad-based increase across sectors may be more resilient than growth concentrated in one commodity, although this release by itself does not establish the longer-term durability of the trend.
Imports also have multiple meanings. Imports of machinery, energy and industrial inputs can rise when firms produce more or invest in capacity; imports of some consumer goods or commodities can reflect different demand and price patterns. A trade deficit is therefore an accounting result, not a complete verdict on economic health. Its implications depend on composition, financing, external balances, exchange-rate conditions and the wider macroeconomic situation.
For banking and economic-awareness candidates, the takeaway is to avoid the common mistake of treating “exports increased” as synonymous with “trade surplus increased.” The numbers show that total exports grew, but imports were greater than exports and the combined deficit widened over April–September.
Static GK and institutional connections
The Ministry of Commerce and Industry issues the trade summary used for this current-affairs update through PIB. The Reserve Bank of India supplies data relevant to services and balance-of-payments statistics, and the official release explains the reference-period limitation. A balance of payments is a broader record of a country’s transactions with the rest of the world; the merchandise trade balance is only one component of external transactions.
India facts: Prime Minister Narendra Modi; President Droupadi Murmu; capital New Delhi; currency Indian rupee (₹). The reported trade values in this release are denominated in US dollars, which is why currency notation should be kept explicit in notes.
Possible MCQ areas
Revise the total exports figure of US$476.20 billion and growth rate of 13.84%; merchandise exports of US$259.89 billion and 18.51% growth; services exports of US$216.31 billion; estimated imports of US$551.13 billion; and the combined trade deficit of US$74.93 billion. Also prepare the electronics export value and 70.44% increase for September, the engineering-goods figure, and the distinction between merchandise exports, services exports and a trade balance.
A data-interpretation question might ask which category had the higher absolute September value, electronics or engineering goods; another might ask why estimated services figures require a caveat. Do not memorise percentages without pairing each with its date and denominator.
Official source
Ministry of Commerce and Industry: cumulative exports for April–September 2026–27, published 15 October 2026. The release contains the comparison tables, sector-level changes and data caveats.
Related reading
- Daily Current Affairs 16 October 2026
- Daily Current Affairs 15 October 2026
- GSDP estimates and the expenditure approach
- Banking Awareness and Study Material · Current Affairs Hub · Competitive Exams Preparation Hub
These are the estimates quoted from the Ministry’s dated release. Check for revised official data before using the figures as final numbers in later reports.