Published: 18 November 2026 | Reading time: 8–9 minutes
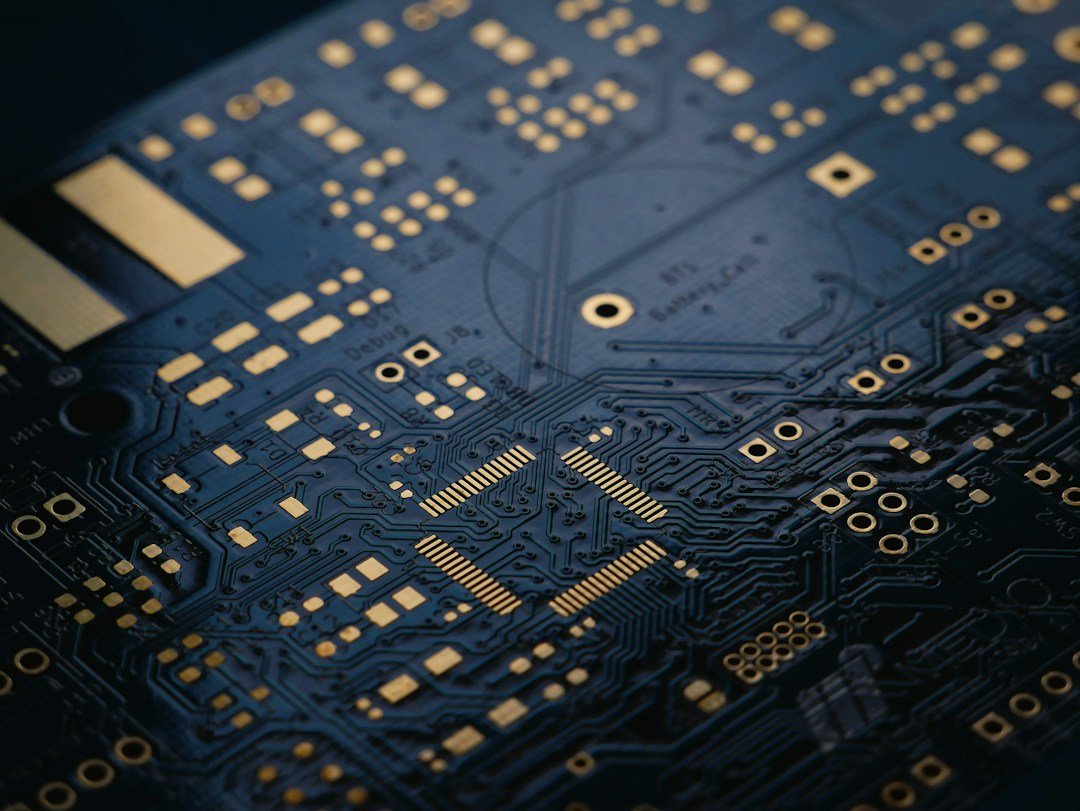
Illustrative image credit: Vishnu Mohanan via Unsplash.
India’s electronic goods exports reached US$31.97 billion during April–September of financial year 2026–27, a rise of 44% over the same six months a year earlier. The Ministry of Commerce and Industry released the figures on 17 November 2026. The headline is strong, but the more useful signal lies inside the export basket: non-smartphone electronics grew faster than smartphones, and their share of total electronic goods exports increased. That shift matters because a durable electronics export base depends not only on assembling finished phones but also on producing components, circuit boards, communication equipment, memory products and storage devices.
What happened?
According to the Ministry’s release, electronic goods exports increased from US$22.20 billion in April–September FY 2025–26 to US$31.97 billion in April–September FY 2026–27. Smartphones remained the largest single component, with exports of US$18.17 billion. However, the non-smartphone segment recorded the faster growth rate and reached US$13.79 billion.
The release identifies growth across mounted printed circuit boards, populated circuit boards, network transmission and routing equipment, memory integrated circuits and solid-state non-volatile storage devices. These are not interchangeable products: they occupy different stages and functions in the electronics value chain. Their performance helps explain why the Ministry describes the export basket as becoming broader and more diversified.
The numbers behind the 44% growth
| Export category | April–September FY 2026–27 | Change / comparison |
|---|---|---|
| Total electronic goods | US$31.97 billion | +44.0%; from US$22.20 billion |
| Smartphones | US$18.17 billion | +35.8%; from US$13.38 billion |
| Non-smartphone electronics | US$13.79 billion | +56.5%; from US$8.81 billion |
| Smartphone share | 56.8% | Down from 60.3% |
| Non-smartphone share | 43.2% | Up from 39.7% |
| Mounted printed circuit boards | US$2.10 billion | From US$63.3 million; +3,219% |
| Populated / loaded PCBs | US$864.1 million | +304%; from US$213.7 million |
| Network transmission and routing equipment | US$1.45 billion | +98% |
| Memory integrated circuits | US$562.4 million | +2,333%; from US$23.1 million |
| Solid-state non-volatile storage devices | US$260.5 million | +1,680%; from US$14.6 million |
The share movement is particularly important. Smartphones still accounted for more than half of the export value, but their share fell from 60.3% to 56.8% because other electronics categories expanded more quickly. Non-smartphone electronics increased their share from 39.7% to 43.2%. This is a change in composition, not a decline in smartphone exports: smartphone exports themselves rose by 35.8%.
Why it matters: export growth beyond final assembly
Electronics manufacturing involves a chain of activities. At one end are design, research and specialised components; in the middle are printed circuit boards, semiconductor devices, memory and communication modules; at the other end are finished products such as smartphones, computers and network equipment. A country that exports only assembled finished goods may remain dependent on imported components and high-value inputs. Growth in components and sub-assemblies can deepen domestic supplier networks, create specialised manufacturing jobs and improve the resilience of the production ecosystem.
The latest data are therefore encouraging because they show faster growth in non-smartphone segments. The figures do not, by themselves, establish how much domestic value is retained in India, how much of the input content is imported, or the profitability of individual manufacturers. Export value is a gross trade measure; it is not the same as domestic value addition. For a balanced assessment, candidates should distinguish export growth from local-content ratios, investment, production, employment and technology ownership.
What the product-level figures tell us
1. Printed circuit boards: a key part of the electronics supply chain
Mounted printed circuit board parts and accessories recorded a particularly large increase, from US$63.3 million to US$2.10 billion. The Ministry reports Singapore as the leading destination for this category at US$1.87 billion, followed by China at US$111.5 million. The percentage increase of 3,219% is striking, but it starts from a small base. A large percentage rise should not be interpreted as proof that the category is already larger than smartphones or that the same growth rate will continue.
Populated, loaded or stuffed printed circuit board exports rose 304%, from US$213.7 million to US$864.1 million. China was the leading destination at US$789.2 million. These figures indicate increased cross-border trade in boards and assemblies that form the electronic circuitry of many products.
2. Network equipment and connectivity hardware
Exports of network transmission and routing equipment increased 98%, from US$732.9 million to US$1.45 billion. Hong Kong was the leading destination in the release’s breakdown, with exports increasing to US$857.7 million. The United States and the Netherlands were also important markets. This category connects electronics exports with telecom networks, data infrastructure and enterprise connectivity.
3. Memory and storage devices
Memory integrated circuit exports rose from US$23.1 million to US$562.4 million, while solid-state non-volatile storage device exports increased from US$14.6 million to US$260.5 million. Malaysia led as a destination for memory ICs, while China was the leading destination for solid-state storage devices. These are high-growth percentages from small starting values; they should be read alongside absolute export values.
Markets: where the products are going
The release identifies Singapore, China, Hong Kong and Malaysia among the leading destinations for the product categories discussed. The destination varies by product: Singapore led for mounted PCB parts and memory ICs; China led for populated circuit boards and solid-state storage devices; Hong Kong was prominent for network transmission equipment. This concentration underlines the importance of regional electronics supply chains in Asia.
For international trade analysis, destination data are useful but incomplete. They do not by themselves show the final consumer market for every component, because electronics components can move between countries before being incorporated into finished products. Nor do the figures establish the share of exports attributable to individual firms. They provide a snapshot of reported product-level trade flows.
Background: how this connects with India’s electronics policy
India has pursued electronics manufacturing through a mix of production-linked incentives, support for electronics components, semiconductor ecosystem development, infrastructure and trade facilitation. The objective is to attract investment, scale manufacturing, develop component suppliers and reduce vulnerabilities in supply chains. The Semicon 2.0 portal and the Electronics Components Manufacturing Scheme are part of this wider policy environment, but policy approvals and export performance are different indicators.
A scheme approval is not the same as a factory becoming operational; a projected investment is not the same as realised investment; and production is not the same as exports. Candidates should keep these measures separate. The latest export figures provide evidence of trade performance for a six-month period. They do not establish that every policy target has already been achieved.
For context, DailyGKUpdate has separately covered the Semicon 2.0 portal and electronics-component approvals and the NITI Aayog assessment of production-linked incentive schemes. Those articles discuss the policy and manufacturing framework; this report focuses on export outcomes.
What the data cannot prove
- It is a six-month result: April–September FY 2026–27 should not be presented as a full-year export figure.
- Gross exports are not domestic value addition: the release does not provide a complete local-content calculation.
- High growth can reflect a low base: the PCB and memory categories show very high percentage increases from smaller previous values.
- Export value is not profitability: the figures do not disclose margins, input costs or firm-level financial performance.
- Growth is not uniform: different products and destinations show different rates and values.
Key facts for quick revision
- Releasing Ministry: Ministry of Commerce and Industry.
- Minister: Piyush Goyal, Union Minister of Commerce and Industry.
- Period: April–September FY 2026–27.
- Total electronic goods exports: US$31.97 billion.
- Growth: 44% over the corresponding period of FY 2025–26.
- Smartphone exports: US$18.17 billion; growth 35.8%.
- Non-smartphone exports: US$13.79 billion; growth 56.5%.
- Leading non-smartphone growth categories include PCBs, network equipment, memory ICs and storage devices.
Exam relevance
UPSC GS-III: manufacturing, industrial policy, export competitiveness, supply-chain resilience, technology and value addition. A mains answer can use the 44% headline alongside the faster 56.5% growth in non-smartphone exports to show a changing export mix, while acknowledging the need for deeper domestic value addition.
State PSC and economics examinations: revise the Ministry, trade period, product categories, export destinations and the distinction between gross exports and value addition. SSC, Railways and Banking: focus on the US$31.97 billion total, 44% growth, smartphone/non-smartphone split and the key product-level figures. Banking and finance candidates can connect export growth with foreign-exchange earnings, trade finance, working-capital requirements and supply-chain credit.
Static GK connection
- HS code: Harmonized System code used to classify traded goods for customs and trade statistics.
- PCB: Printed circuit board, which mechanically supports and electrically connects electronic components.
- IC: Integrated circuit, a semiconductor device containing interconnected electronic components.
- Export: Goods produced or supplied in one economy and sold to a buyer in another economy.
- Trade balance: Difference between the value of a country’s exports and imports of goods over a period.
India: country facts for static GK
President: Droupadi Murmu; Prime Minister: Narendra Modi; Capital: New Delhi; Currency: Indian rupee (INR). The release was issued by the Ministry of Commerce and Industry, headed by Union Minister Piyush Goyal.
Possible MCQ areas
- What was the value of India’s electronic goods exports in April–September FY 2026–27?
- Which segment grew faster: smartphones or non-smartphone electronics?
- What was the export value of smartphones during the period?
- Which product category recorded 3,219% growth?
- Which Ministry released the export figures?
- What does an HS code identify in international trade?
Official source
PIB, Ministry of Commerce and Industry: India’s Electronic Goods Exports Grow 44% to US$31.97 Billion, 17 November 2026. All figures in this article are taken from the ministry’s release.
Related articles on DailyGKUpdate
- Semicon 2.0 and 12 electronics-component approvals
- NITI Aayog’s PLI impact assessment
- Daily Current Affairs 18 November 2026
- India’s broader exports: April–September 2026–27
Editorial note: the data refer to electronic goods exports in April–September FY 2026–27 as reported by the Ministry on 17 November 2026. No full-year projection is inferred from this six-month result.